


Blendos Spring Basketball Leagues Week 4 recap
- Mar 31
- 26 min read
Sunday, March 29, 2026 | Oneonta Armory
The 2026 Spring League is living proof of the vision that began in 2016. From the first SUNY Oneonta team recruited by the late Blendos Hall of Famer Jonathan “Bubba” Robbins, through the 2017 season that added Hartwick College and players traveling from Wells College, the league has always maintained a local college presence. What we’re witnessing now — the full-scale integration of SUNY Oneonta split into Red and White in the A League, combined with the depth across 13 B League teams — is the realization of a decade-long dream. The ultimate goal of two SUNY Oneonta teams, two Hartwick basketball teams, a Hartwick football squad, plus college players from Binghamton, Albany, and SUNY Cobleskill is no longer a distant hope; it is actively taking shape on the court.
This Sunday marked a historic milestone for the league. After a decade of dedicated effort, the SUNY Oneonta Men’s Basketball program is now fully integrated into the Spring A League, split into Red and White teams. The community finally has legitimate local bragging rights and elite-level competition on the floor. Every A League team has now played at least one game, and the B League delivered blowouts, comebacks, overtime thrillers, and high-level play. The Co-ed league also launches this Friday — the full Blendos spring schedule is hitting its stride.
We are building something truly special: a recreational basketball program that can stand among the best in the country — competitive, inclusive, family-oriented, and now featuring Division III college talent.
B League Game Recaps

Game 1 – 2:00 PM Poolbrook Contracting (Gold) 27 – Pink 96
Game Flow & In-Depth Statistical Analysis
Pink dominated from tip-off, leading 46-15 at halftime and cruising to a 69-point victory. Gold shot a dismal 22% from the field (11-50 FG), committed 36 turnovers, and were out-rebounded by 31. Pink posted 14 steals as a team while shooting a balanced 44% overall and controlling the glass.
Standout Performances
Alex Woeppel (Pink): 26 PTS (10-20 FG, 4-8 3PT), 17 REB, 6 AST, 1 STL, 3 BLK — Double-Double (PTS/REB)
Malachi Ritter (Pink): 21 PTS (8-17 FG, 5-13 3PT), 6 REB, 3 AST, 1 STL, 2 BLK
Tori Gue (Pink): 8 PTS, 11 REB, 5 AST, 4 STL
Tony Hendrich (Gold): 11 PTS, 10 REB — Double-Double (PTS/REB)
Team Analysis: Pink’s +23 efficiency advantage and +31 rebounding margin showcased complete dominance on both ends. This was a championship-caliber performance that signals Pink as a legitimate title contender when their depth and defensive pressure are fully engaged. Gold’s offensive struggles and turnover issues continue to be a major concern early in the season.

Game 2 – 2:50 PM Pink 50 – Red 56
Game Flow & In-Depth Statistical Analysis
Red started shorthanded (4-on-5) and were trailing 35-27 at halftime. Red flipped the script in the second half with a +14 scoring margin to win by 6. Bisskit Robinson’s late injury was a turning point. Ray Williams arrived shortly after tip-off and immediately stabilized Red.
Standout Performances
George Sheley (Red): 22 PTS (8-25 FG, 4-19 3PT), 5 REB, 5 AST, 3 STL, 1 BLK
Ray Williams (Red): 16 PTS (7-13 FG), 6 REB, 1 AST, 3 STL, 3 TO (impact arrival)
Derek Wright (Red): 8 PTS, 14 REB, 1 BLK
Malachi Ritter (Pink): 9 PTS (3-11 FG, 3-9 3PT), 5 REB, 3 STL, 3 BLK
Alex Woeppel (Pink): 10 PTS, 7 REB, 5 AST, 4 STL
Team Analysis: Red’s second-half adjustment and ability to exploit Pink’s depleted rotation were decisive. The game highlighted Red’s resilience and depth, even while playing catch-up. Pink showed fight early but the late injury proved too much to overcome. This win keeps Red undefeated and demonstrates their ability to grind out victories.

Game 3 – 4:00 PM Oneonta Job Corps Academy (White) 47 – MAMCO (Grey) 51 (OT)
Game Flow & In-Depth Statistical Analysis
Tied at 45-45 after regulation. MAMCO’s veteran composure won out in overtime (6-2 edge).
Standout Performances
Sylvester Bassett (OJCA White): 18 PTS (6-19 FG, 5-15 3PT), 11 REB, 2 AST, 2 BLK — Double-Double (PTS/REB)
Moises Bane (OJCA White): 4 PTS, 15 REB, 2 AST, 1 BLK
James Bunton (OJCA White): 11 PTS, 6 REB, 3 AST, 6 TO, 1 BLK
Jared Conklin (MAMCO Grey): 13 PTS, 7 REB, 2 AST
Naji Lawrence (MAMCO Grey): 6 PTS, 7 REB, 1 STL, 1 BLK
Tom Dorritie (MAMCO Grey): 4 PTS, 8 REB, 6 TO (strong rebounding in his long-awaited return to the Blendos league)
Advanced Analysis: MAMCO’s +4 efficiency in OT and control of the glass (50 total rebounds) were the difference.

Game 4 – 5:00 PM MAMCO (Grey) 61 – Orchid 51
Game Flow & In-Depth Statistical Analysis MAMCO built a 35-20 halftime lead and held off a late Orchid push to win by 10.
Standout Performances
Jared Conklin (MAMCO Grey): 20 PTS (7-16 FG, 2-6 3PT), 6 REB, 3 AST
Naji Lawrence (MAMCO Grey): 10 PTS (4-8 FG, 2-3 3PT), 8 REB, 2 BLK
Scott Johnson (MAMCO Grey): 11 PTS, 8 REB, 1 BLK
Kaiden Legree (Orchid): 14 PTS (5-16 FG, 3-9 3PT), 4 REB, 1 STL, 1 BLK
Graham Wooden (Orchid): 7 PTS, 3 REB, 2 BLK
Advanced Analysis: MAMCO’s +10 rebounding advantage and superior shooting efficiency (41% vs 32%) proved decisive.
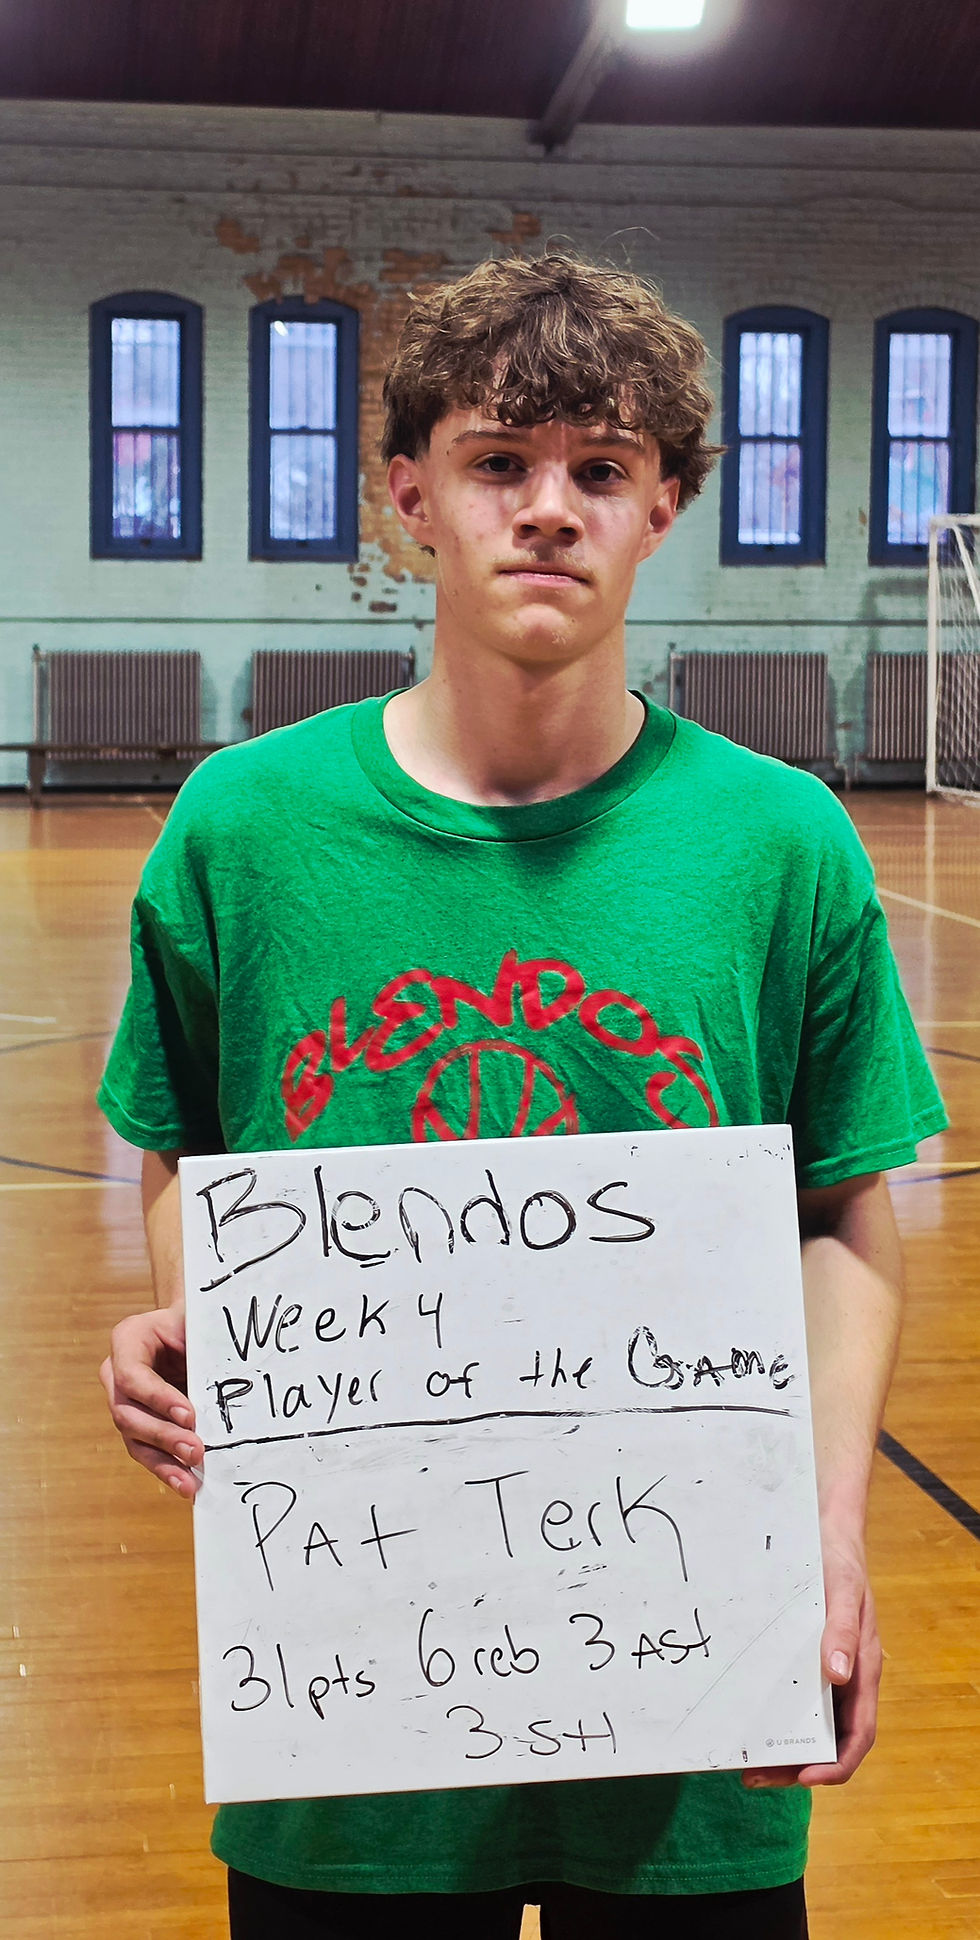
Game 5 – 5:50 PM Green 86 – Bello/Richfield (Midnight Navy) 82
Game Flow & In-Depth Statistical Analysis A high-scoring, back-and-forth battle. Bello/Richfield led 43-32 at halftime, but Green exploded for 54 second-half points to overcome the deficit and win by 4.
Standout Performances
Jo Annan (Bello/Richfield): 35 PTS (11-23 FG, 8-15 3PT), 10 REB, 9 AST, 2 STL, 2 BLK — near triple-double performance
Jack Langstaff (Green): 22 PTS (8-13 FG, 6-8 3PT), 5 REB, 2 AST — efficient shooting night
Pat Terk (Green): 31 PTS (10-20 FG, 5-10 3PT), 6 REB, 3 AST, 2 STL, 3 BLK
Sawyer Furman (Green): 16 PTS, 12 REB, 3 AST, 2 STL, 1 BLK — Double-Double (PTS/REB)
Eddie Bello (Bello/Richfield): 11 PTS, 2 REB, 2 AST
Advanced Analysis: Green’s second-half explosion (+22 scoring margin) and 52% field goal shooting overwhelmed Bello/Richfield’s early lead. Jo Annan’s near triple-double kept Bello competitive, but Green’s depth and hot shooting proved too much
B League Full Team Comparison After Week 4
Standings (All teams have played at least 3 games. Top 8 make single-elimination playoffs. B League divided into two divisions with B1 having a tougher anticipated strength of schedule.)
# | Team | GP | W | L | PCT | GB | Home | Away | +/- | Last 10 | Streak |
1 | Purple | 4 | 4 | 0 | 1.000 | - | 2-0 | 2-0 | +89 | 4-0 | W4 |
2 | Red | 4 | 4 | 0 | 1.000 | - | 2-0 | 2-0 | +95 | 4-0 | W4 |
3 | Team Blendos (Black) | 4 | 4 | 0 | 1.000 | - | 1-0 | 3-0 | +104 | 4-0 | W4 |
4 | MAMCO (Grey) | 5 | 4 | 1 | .800 | 0.5 | 3-1 | 1-0 | +9 | 4-1 | W2 |
5 | Orchid | 5 | 3 | 2 | .600 | 1.5 | 2-2 | 1-0 | +8 | 3-2 | L2 |
6 | Pink | 5 | 3 | 2 | .600 | 1.5 | 2-1 | 1-1 | +112 | 3-2 | L1 |
7 | Carolina Blue | 3 | 2 | 1 | .667 | 1.5 | 0-0 | 2-1 | +18 | 2-1 | W1 |
8 | Green | 4 | 1 | 3 | .250 | 3 | 0-2 | 1-1 | -51 | 1-3 | W1 |
9 | Oneonta Job Corps Academy (White) | 4 | 1 | 3 | .250 | 3 | 0-0 | 1-3 | -31 | 1-3 | L1 |
10 | Royal Blue | 3 | 0 | 3 | .000 | 3.5 | 0-3 | 0-0 | -79 | 0-3 | L3 |
11 | Sapphire | 3 | 0 | 3 | .000 | 3.5 | 0-1 | 0-2 | -61 | 0-3 | L3 |
12 | Bello/Richfield (Midnight Navy) | 4 | 0 | 4 | .000 | 4 | 0-2 | 0-2 | -26 | 0-4 | L4 |
13 | Poolbrook Contracting (Gold) | 4 | 0 | 4 | .000 | 4 | 0-2 | 0-2 | -187 | 0-4 | L4 |
A League Week 4 Recap

Game 1 – 6:45 PM Bello Electric (Navy) 69 – Orange 56
Game Flow & In-Depth Statistical Analysis
This was a highly anticipated grudge match and rematch from last week, where Orange had taken the victory. Bello Electric (Navy) came out determined to even the season series at 1-1. Bello jumped out to a strong 37-24 first-half lead and never looked back, controlling the pace and securing a 13-point win. Bello shot efficiently at 50% from the field (42% from three) while dominating the rebounding battle 39-34 and posting a commanding +23 efficiency advantage (83 vs 46). Orange fought hard in the second half but could not overcome the early deficit or Bello’s balanced, efficient attack.
Standout Performances
Danny Njoku (Bello Electric Navy): 33 PTS (10-18 FG, 5-11 3PT, 8-9 FT), 9 REB, 5 AST, 2 STL, 1 BLK — dominant all-around game
Xavier Hill (Orange): 26 PTS (7-20 FG, 1-4 3PT, 11-14 FT), 11 REB, 2 STL
Jo Annan (Orange): 13 PTS (4-11 FG, 2-5 3PT, 3-4 FT), 7 REB, 4 AST, 3 BLK, 2 STL
Jonathan Codrington (Bello Electric Navy): 9 PTS, 8 REB, 3 AST, 2 STL, 1 BLK
Zyeir Lawrence (Bello Electric Navy): 11 PTS, 12 REB, 2 AST, 1 STL, 3 BLK
Advanced Analysis: Bello Electric’s superior efficiency, rebounding control, and first-half dominance set the tone for the rematch victory. Orange’s veterans (Xavier Hill dropping 26 points and Jo Annan contributing 13 points with strong defense) kept the game competitive, but Bello’s depth and execution proved too much. Splitting the season series 1-1 adds extra intrigue to this matchup moving forward

Game 2 – 7:45 PM Gold 76 – White 75
Game Flow & In-Depth Statistical Analysis
In their very first game as part of the Blendos Spring A League, White took on undefeated Gold in a thrilling one-point matchup. Gold built a slim 45-42 halftime lead and held on through a back-and-forth second half to improve to 3-0. White showed impressive fight in their debut, keeping the game extremely close despite the high stakes of a doubleheader schedule. Both teams shot around 40-44% from the field in a contest that immediately validated the new Red/White split and the integration of SUNY Oneonta talent.
Standout Performances
Pat Evans (White): 27 PTS (10-16 FG, 6-12 3PT, 1-1 FT), 6 REB, 3 AST — explosive scoring in the debut
Aaron Smith (Gold): 19 PTS (6-11 FG, 4-9 3PT, 3-4 FT), 7 REB, 4 AST, 2 STL, 2 BLK — efficient and well-rounded
Cam LaClair (White): 20 PTS (8-18 FG, 3-11 3PT), 7 REB, 3 AST, 1 STL
Jared Benson (Gold): 20 PTS (7-17 FG, 6-12 3PT), 1 REB, 3 AST
Evan Lane (Gold): 16 PTS (6-15 FG, 2-6 3PT), 14 REB, 2 AST, 1 STL — strong rebounding presence
Mason Weir (Gold): 16 PTS (6-11 FG, 3-7 3PT), 5 REB, 7 AST, 2 STL, 1 BLK —
Advanced Analysis: Gold held slight edges in efficiency (93 vs 90) and rebounding (38-41, a tight battle), while White kept it extremely competitive with strong three-point shooting (36%). The game came down to execution in the final minutes, with Gold’s balanced contributions from Aaron Smith, Jared Benson, Evan Lane, and Mason Weir proving just enough to edge White in their debut. This nail-biter delivered exactly the high-level, competitive basketball intended. Video of the game can be found here: https://www.youtube.com/watch?v=cpHCvKrxYKQ

Game 3 – 8:45 PM Red 95 – White 100
Game Flow & In-Depth Statistical Analysis
White wrapped up their historic doubleheader debut with a 1-1 record on the day, defeating Red 100-95 in a high-scoring, competitive battle. Red, playing their first game of the 2026 spring season, put up 95 points but fell just short. This matchup delivered the intense local-rivalry basketball the community has been anticipating between the two SUNY Oneonta-split teams. Red saw the return of Kobe Long (who will only be playing this week) and will look to bounce back in upcoming weeks with a couple of additional roster adds.
Standout Performances
Kobe Long (Red): 35 PTS (14-25 FG, 5-15 3PT, 2-2 FT), 10 REB, 3 AST, 3 STL, 1 BLK — outstanding return performance
Pat Evans (White): 31 PTS (11-20 FG, 9-16 3PT), 2 REB, 1 AST, 3 STL, 1 BLK
Hobson Herlihy (White): 32 PTS (11-18 FG, 8-12 3PT, 2-3 FT), 6 REB, 4 AST, 3 STL, 2 BLK — highly efficient scoring
Shea Barber (Red): 22 PTS (8-19 FG, 5-13 3PT, 1-2 FT), 7 REB, 4 AST, 3 STL, 1 BLK
Kaden Gonzalez (White): 17 PTS (7-12 FG, 3-8 3PT), 10 REB, 1 AST, 2 STL
Delano Knox (Red): 18 PTS (8-15 FG), 9 REB, 2 AST, 3 STL, 1 BLK
Advanced Analysis: White’s ability to handle the demanding doubleheader schedule and maintain energy in the second half (51 points) gave them the edge in this historic rivalry matchup. Red shot efficiently (45% FG) and got a strong 35-point effort from Kobe Long, but White’s depth and hot three-point shooting (44% from deep) proved decisive. The 195 combined points and tight margin underscored the high caliber of play now present in the A League.
part 1 of the game can be found here: https://www.youtube.com/watch?v=VPkB-fbJHOs
part 2 can be found here: https://www.youtube.com/watch?v=cpHCvKrxYKQ
A League Standings After Week 4
# | TEAM | GP | W | L | PCT | GB | HOME | AWAY | +/- | LAST10 | STREAK |
1 | Gold | 3 | 3 | 0 | 1.000 | - | 1-0 | 2-0 | +10 | 3-0 | W3 |
2 | Orange | 3 | 2 | 1 | .667 | 1 | 2-1 | 0-0 | +4 | 2-1 | L1 |
3 | White | 2 | 1 | 1 | .500 | 1.5 | 1-1 | 0-0 | +4 | 1-1 | W1 |
4 | Bello Electric (Navy) | 3 | 1 | 2 | .333 | 2 | 0-0 | 1-2 | 0 | 1-2 | W1 |
5 | Red | 1 | 0 | 1 | .000 | 2 | 0-0 | 0-1 | -5 | 0-1 | L1 |
6 | J & D Wagon Wheel (Blue) | 2 | 0 | 2 | .000 | 2.5 | 0-1 | 0-1 | -13 | 0-2 | L2 |
A League Player Statistical Leaders – After Week 4
Week 4 has delivered a clear picture of the elevated talent level in the A League. With the SUNY Oneonta split now fully active and several high-level veterans and college players on the floor, the statistical leaders reflect a league that is both high-scoring and highly efficient. Danny Njoku (Bello Electric) and Kobe Long (Red) are emerging as the two dominant forces, while Evan Lane (Gold) is controlling the glass like few others can. Here is the complete Top 10 breakdown for every major category shown in the official stats.
Scoring
Points Per Game
Kobe Long (Red) – 35.0
Danny Njoku (Bello Electric) – 29.3
Pat Evans (White) – 29.0
Graham Wooden (Gold) – 26.5
Xavier Hill (Orange) – 25.5
Jason Tagios (J&D Wagon Wheel) – 25.0
Hobson Herlihy (White) – 22.5
Shea Barber (Red) – 22.0
Jared Benson (Gold) – 20.0
Zyeir Lawrence (Bello Electric) – 19.0
Total Points
Danny Njoku (Bello Electric) – 88
Pat Evans (White) – 58
Zyeir Lawrence (Bello Electric) – 57
Evan Lane (Gold) – 56
Graham Wooden (KKP) – 53
Jo Annan (Orange) – 51
Xavier Hill (Orange) – 51
Aaron Smith (Gold) – 51
Hobson Herlihy (White) – 45
Anthony Graffio-Jackson (J&D Wagon Wheel) – 35
Insight: Kobe Long’s 35 PPG explosion in his one-week return immediately makes him the scoring champion, while Danny Njoku’s volume (88 total points) shows he is the most consistent force on a nightly basis.
Shooting Efficiency
Field Goal Percentage
Jason Tagios (J&D Wagon Wheel) – 77%
Aaron Smith (Gold) – 63%
Jonathan Codrington (Bello Electric) – 62%
Solomon Mason (J&D Wagon Wheel) – 60%
Pat Evans (White) – 58%
Kobe Long (Red) – 56%
Mason Weir (Gold) – 55%
Hobson Herlihy (White) – 53%
Delano Knox (Red) – 53%
Xavier Hill (Orange) – 53%
2-Point Field Goal Percentage
Xavier Beers (J&D Wagon Wheel) – 100%
Noah Collin (J&D Wagon Wheel) – 100%
Aaron Smith (Gold) – 100%
Kobe Long (Red) – 90%
Kaden Gonzalez (White) – 83%
Solomon Mason (J&D Wagon Wheel) – 83%
Jason Tagios (J&D Wagon Wheel) – 83%
Pat Evans (White) – 75%
Danny Njoku (Bello Electric) – 74%
(tie) several at 70%+
3-Point Field Goal Percentage
Tony Hendrich (Bello Electric) – 100%
Jesse Woodard (Orange) – 100%
Jason Tagios (J&D Wagon Wheel) – 71%
Anthony Graffio-Jackson (J&D Wagon Wheel) – 63%
Mason Weir (Gold) – 58%
Hobson Herlihy (White) – 55%
Aaron Smith (Gold) – 55%
Pat Evans (White) – 54%
Jared Benson (Gold) – 50%
Solomon Mason (J&D Wagon Wheel) – 44%
True Shooting Percentage
Jason Tagios (J&D Wagon Wheel) – 96.15%
Aaron Smith (Gold) – 87.09%
Pat Evans (White) – 79.58%
Jesse Woodard (Orange) – 79.58%
Mason Weir (Gold) – 74.32%
Solomon Mason (J&D Wagon Wheel) – 73.33%
Hobson Herlihy (White) – 71.84%
Kobe Long (Red) – 67.62%
Danny Njoku (Bello Electric) – 65.20%
Graham Wooden (KKP) – 64.57%
Effective Field Goal Percentage
Jason Tagios (J&D Wagon Wheel) – 96.15%
Aaron Smith (Gold) – 85.42%
Pat Evans (White) – 79.17%
Jesse Woodard (Orange) – 75.00%
Solomon Mason (J&D Wagon Wheel) – 73.33%
Mason Weir (Gold) – 72.50%
Hobson Herlihy (White) – 71.67%
Kobe Long (Red) – 66.00%
Jonathan Codrington (Bello Electric) – 61.54%
Anthony Graffio-Jackson (J&D Wagon Wheel) – 61.11%
Free Throw Percentage
Chris* (Bello Electric) – 100%
Pat Evans (White) – 100%
Jacob Jerome (White) – 100%
Kobe Long (Red) – 100%
Adan Madera (J&D Wagon Wheel) – 100%
Dre Palmer (Orange) – 100%
Graham Wooden (KKP) – 100%
Danny Njoku (Bello Electric) – 88%
Jazz Burks (Orange) – 83%
Aaron Smith (Gold) – 83%
Insight: The shooting efficiency numbers are elite. Jason Tagios is operating at near-perfect levels, while Kobe Long and Pat Evans are combining volume with accuracy — a deadly combination for any defense.
Playmaking & Defense
Assists Per Game
Jo Annan (Orange) – 5.3
Sam Booth (Gold) – 5.0
Mason Weir (Gold) – 4.7
Danny Njoku (Bello Electric) – 4.3
Shea Barber (Red) – 4.0
Nate Cohen (Red) – 4.0
Zyeir Lawrence (Bello Electric) – 4.0
Graham Wooden (KKP) – 4.0
Jonathan Codrington (Bello Electric) – 3.5
Dylan Jaklitsch (KKP) – 3.5
Assists (Total)
Jo Annan (Orange) – 16
Mason Weir (Gold) – 14
Danny Njoku (Bello Electric) – 13
Zyeir Lawrence (Bello Electric) – 12
Aaron Smith (Gold) – 8
Graham Wooden (KKP) – 8
Jonathan Codrington (Bello Electric) – 7
Dylan Jaklitsch (KKP) – 7
Kevin Kurkowski (KKP) – 7
Jazz Burks (Orange) – 6
Steals Per Game
Jonathan Codrington (Bello Electric) – 2.5
Hobson Herlihy (White) – 2.5
Jo Annan (Orange) – 2.0
Nate Cohen (Red) – 2.0
Danny Njoku (Bello Electric) – 2.0
Xavier Hill (Orange) – 1.5
Graham Wooden (KKP) – 1.5
Aaron Smith (Gold) – 1.3
Sam Booth (Gold) – 1.0
Noah Collin (J&D Wagon Wheel) – 1.0
Steals (Total)
Jo Annan (Orange) – 6
Danny Njoku (Bello Electric) – 6
Jonathan Codrington (Bello Electric) – 5
Hobson Herlihy (White) – 5
Aaron Smith (Gold) – 4
Xavier Hill (Orange) – 3
Zyeir Lawrence (Bello Electric) – 3
Mason Weir (Gold) – 3
Graham Wooden (KKP) – 3
Jazz Burks (Orange) – 2
Blocks Per Game
Zyeir Lawrence (Bello Electric) – 2.3
Evan Lane (Gold) – 1.3
Jon Bangel (Orange) – 1.0
Shea Barber (Red) – 1.0
Delano Knox (Red) – 1.0
Kobe Long (Red) – 1.0
Deion Mitchell (White) – 1.0
Danny Njoku (Bello Electric) – 0.7
Jonathan Codrington (Bello Electric) – 0.5
Kaden Gonzalez (White) – 0.5
Blocks (Total)
Zyeir Lawrence (Bello Electric) – 7
Evan Lane (Gold) – 4
Jon Bangel (Orange) – 2
Deion Mitchell (White) – 2
Danny Njoku (Bello Electric) – 2
Jo Annan (Orange) – 1
Shea Barber (Red) – 1
Jonathan Codrington (Bello Electric) – 1
Kaden Gonzalez (White) – 1
Delano Knox (Red) – 1
Advanced Metrics
Efficiency
Danny Njoku (Bello Electric) – 86
Evan Lane (Gold) – 69
Jo Annan (Orange) – 60
Aaron Smith (Gold) – 60
Zyeir Lawrence (Bello Electric) – 59
Pat Evans (White) – 53
Graham Wooden (KKP) – 53
Xavier Hill (Orange) – 50
Hobson Herlihy (White) – 46
Mason Weir (Gold) – 45
Game Score
Kobe Long (Red) – 23.9
Danny Njoku (Bello Electric) – 21.4
Pat Evans (White) – 21.0
Graham Wooden (KKP) – 20.1
Jason Tagios (J&D Wagon Wheel) – 17.6
Hobson Herlihy (White) – 17.1
Xavier Hill (Orange) – 17.0
Aaron Smith (Gold) – 15.3
Jared Benson (Gold) – 12.0
Shea Barber (Red) – 12.0
Rebounds Per Game
Evan Lane (Gold) – 12.7
Zyeir Lawrence (Bello Electric) – 10.0
Kobe Long (Red) – 10.0
Xavier Hill (Orange) – 9.5
Connor Mannix (White) – 9.5
Jo Annan (Orange) – 9.0
Anthony Graffio-Jackson (J&D Wagon Wheel) – 9.0
Trevor Huntsman (Red) – 9.0
Delano Knox (Red) – 9.0
Nate Cohen (Red) – 8.0
Total Rebounds
Evan Lane (Gold) – 38
Zyeir Lawrence (Bello Electric) – 30
Jo Annan (Orange) – 27
Tony Hendrich (Bello Electric) – 22
Dre Palmer (Orange) – 22
Xavier Hill (Orange) – 19
Connor Mannix (White) – 19
Danny Njoku (Bello Electric) – 19
Anthony Graffio-Jackson (J&D Wagon Wheel) – 18
Kaden Gonzalez (White) – 16
Field Goals Made
Danny Njoku (Bello Electric) – 29
Evan Lane (Gold) – 23
Pat Evans (White) – 21
Zyeir Lawrence (Bello Electric) – 21
Jo Annan (Orange) – 19
Xavier Hill (Orange) – 17
Hobson Herlihy (White) – 16
Graham Wooden (KKP) – 16
Aaron Smith (Gold) – 15
Anthony Graffio-Jackson (J&D Wagon Wheel) – 14
Field Goals Attempted
Danny Njoku (Bello Electric) – 60
Zyeir Lawrence (Bello Electric) – 54
Evan Lane (Gold) – 53
Jo Annan (Orange) – 46
Jonny Marsh (Orange) – 39
Pat Evans (White) – 36
Graham Wooden (KKP) – 34
Xavier Hill (Orange) – 32
Dre Palmer (Orange) – 31
Hobson Herlihy (White) – 30
3-Point Field Goals Made Per Game
Pat Evans (White) – 7.5
Jared Benson (Gold) – 6.0
Hobson Herlihy (White) – 5.5
Shea Barber (Red) – 5.0
Kobe Long (Red) – 5.0
Danny Njoku (Bello Electric) – 5.0
Jason Tagios (J&D Wagon Wheel) – 5.0
Nate Cohen (Red) – 4.0
Aaron Smith (Gold) – 3.7
Jonny Marsh (Orange) – 3.3
3-Point Field Goals Attempted Per Game
Kobe Long (Red) – 15.0
Pat Evans (White) – 14.0
Danny Njoku (Bello Electric) – 13.7
Shea Barber (Red) – 13.0
Jonny Marsh (Orange) – 10.7
Hobson Herlihy (White) – 10.0
Zyeir Lawrence (Bello Electric) – 10.0
Aaron Smith (Gold) – 9.5
Graham Wooden (KKP) – 9.5
(tie) several at 8–9
Free Throws Made
Graham Wooden (KKP) – 16
Xavier Hill (Orange) – 15
Danny Njoku (Bello Electric) – 15
Zyeir Lawrence (Bello Electric) – 9
Jo Annan (Orange) – 6
Jazz Burks (Orange) – 5
Adan Madera (J&D Wagon Wheel) – 5
Mason Weir (Gold) – 4
Kevin Kurkowski (Gold) – 3
Jonny Marsh (Orange) – 5
Free Throws Attempted
Xavier Hill (Orange) – 22
Danny Njoku (Bello Electric) – 17
Graham Wooden (KKP) – 16
Zyeir Lawrence (Bello Electric) – 12
Aaron Smith (Gold) – 12
Jo Annan (Orange) – 8
Cam LaClair (White) – 7
Jazz Burks (Orange) – 6
Adan Madera (J&D Wagon Wheel) – 6
Jonny Marsh (Orange) – 5
Expert Takeaway
Danny Njoku is the most complete player in the A League right now — leading or near the top in points, efficiency, field goals made/attempted, and even steals/blocks. Kobe Long’s one-week cameo was electric and instantly changed the scoring landscape. Evan Lane is the clear rebounding king, while Jo Annan continues to be the ultimate two-way veteran. White and Red’s debuts have already produced multiple 20+ point scorers, proving the SUNY Oneonta integration is delivering exactly the high-level basketball the league envisioned.
A League Team Statistical Leaders & Analysis – After Week 4
Week 4 has crystallized the transformative impact of the SUNY Oneonta integration. With all six A League teams now in action, the data reveals a league that is scoring at a robust 75.8 points per game while shooting 43% from the field and 36% from three — numbers that reflect both increased talent and the physical, competitive style that defines Blendos basketball. Gold has emerged as the most complete and efficient team, while Red’s explosive debut signals massive offensive potential. Bello Electric (Navy) dominates defensively, and White’s 1-1 doubleheader debut showed they belong immediately. Below is a comprehensive, category-by-category breakdown with league-average context, key insights, and season-long implications.
Scoring & Offensive Production
Points Per Game
Red – 95.0
White – 87.5
Gold – 80.7 League Avg: 75.8
Bello Electric (Navy) – 73.3
Orange – 66.0
J & D Wagon Wheel (Blue) – 65.5
Points Against Per Game
Orange – 64.7 (best defense)
J & D Wagon Wheel (Blue) – 72.0
Bello Electric (Navy) – 73.3
Gold – 77.3
White – 85.5
Red – 100.0 (small sample)
Insight: Red’s 95-point explosion in their lone game sets the early benchmark for offensive firepower, but Gold leads in total points scored (243) and maintains the best balance. White’s 87.5 PPG in a doubleheader is impressive for a brand-new squad. Orange’s elite points-allowed mark (64.7) shows they can grind out low-scoring wins even when their own offense lags.
Shooting Efficiency
Field Goal Percentage
Gold – 46% (League Avg: 43%)
Red – 45%
J & D Wagon Wheel (Blue) – 45%
White – 43%
Bello Electric (Navy) – 43%
Orange – 37%
Effective Field Goal Percentage
Gold – 57.14%
White – 54.97%
Red – 53.57%
J & D Wagon Wheel (Blue) – 53.45%
Bello Electric (Navy) – 51.36%
Orange – 44.12%
True Shooting Percentage
Gold – 60.74%
White – 55.21%
J & D Wagon Wheel (Blue) – 54.60%
Red – 54.27%
Bello Electric (Navy) – 54.21%
Orange – 47.53%
3-Point Field Goal Percentage
Gold – 41%
White – 40%
J & D Wagon Wheel (Blue) – 35%
Bello Electric (Navy) – 34%
Red – 32%
Orange – 32%
Free Throw Percentage
Gold – 85%
J & D Wagon Wheel (Blue) – 78%
Bello Electric (Navy) – 72%
Orange – 70%
Red – 63%
White – 53%
Insight: Gold is the clear efficiency leader across FG%, eFG%, and TS%. Their 57.14% eFG% is elite for a rec league and suggests sustainable success if they maintain shot quality. Orange’s 37% FG is the biggest red flag — they are winning with defense and rebounding but must improve their finishing to contend long-term.
Rebounding, Defense & Possession
Rebounds Per Game
Red – 43.0
White – 41.5
Bello Electric (Navy) – 34.7
Orange – 34.3
Gold – 30.3
J & D Wagon Wheel (Blue) – 28.5
Total Rebounds
Bello Electric (Navy) – 104
Orange – 103
Gold – 91
White – 83
J & D Wagon Wheel (Blue) – 57
Red – 43
Blocks
Bello Electric (Navy) – 10
Gold – 5
Orange – 4
Red – 3
White – 3
Steals
Bello Electric (Navy) – 16
Orange – 15
Gold – 14
White – 10
Red – 5
J & D Wagon Wheel (Blue) – 4
Turnovers
Red – 16 (lowest)
Gold – 19
J & D Wagon Wheel (Blue) – 19
White – 23
Bello Electric (Navy) – 33
Orange – 34 (highest)
Opponent Field Goal Percentage
Bello Electric (Navy) – 38% (best)
Orange – 42%
Gold – 44%
White – 45%
Red – 46%
J & D Wagon Wheel (Blue) – 46%
Insight: Bello Electric (Navy) is the defensive powerhouse — leading in steals, blocks, and holding opponents to the lowest FG%. Red and White dominate the glass, giving them second-chance opportunities that fuel their high scoring. Orange’s high turnover rate (34) is their biggest weakness; cleaning that up could make them dangerous.
Playmaking
Assists
Gold – 59
Bello Electric (Navy) – 40
Orange – 33
White – 31
Red – 16
J & D Wagon Wheel (Blue) – 15
Assists Per Game
Gold – 19.7
White – 15.5
Red – 16.0
Bello Electric (Navy) – 13.3
Orange – 11.0
J & D Wagon Wheel (Blue) – 7.5
Insight: Gold’s ball movement is elite and directly correlates with their league-leading efficiency. Their 19.7 APG shows a team concept that should translate well as the schedule toughens.
Overall Assessment
Gold currently sits as the most well-rounded and efficient team in the A League, leading in FG%, eFG%, TS%, assists, and free-throw percentage while ranking high in steals. Their +10 point differential and 3-0 record reflect sustainable success. Bello Electric (Navy) is the clear defensive anchor and should be favored in any low-scoring, grind-it-out game. Red’s 95-point debut (with Kobe Long’s one-week cameo) and league-leading rebounding show they have the highest offensive ceiling once their roster stabilizes. White’s 1-1 doubleheader debut was encouraging — they scored efficiently and competed at a high level despite the back-to-back. Orange and J&D Wagon Wheel (Blue) are still searching for offensive consistency, but both have defensive traits that keep them competitive.
The Red vs White rivalry is already living up to the hype, and the integration of SUNY Oneonta talent has raised the floor for the entire league. As the season progresses, the key questions are: Can Gold maintain their efficiency edge? Will Red’s added roster pieces push them into contention? And can White continue to thrive in a demanding schedule?
These numbers confirm what we’ve seen on the floor: the 2026 Spring A League is one the most talented and competitive in Blendos history. The race for the top seed — and bragging rights in the Red vs White matchup — is wide open and will only intensify in the coming weeks.
B League Player & Team Statistical Leaders – After Week 4
With 13 teams now all having played at least three games, the B League has produced the most statistically rich and competitive four weeks in Blendos history. Scoring is up dramatically, efficiency is elite in pockets, and defensive intensity has created clear separation. Shea Barber and Cam Hayes have been the two most dominant individual forces, while Graham Wooden continues to post video-game efficiency.
On the team side, a clear tier structure has emerged: the undefeated trio (Purple, Red, Team Blendos Black) at the top, a hungry middle pack led by MAMCO and Orchid, and a bottom group still searching for consistency.
Below is the complete, expanded breakdown — deeper and more detailed than the A League version, with cross-category insights, team-by-team profiles, playoff implications, and expert commentary on what these numbers mean for the rest of the 7-game season and single-elimination playoffs.
B League Individual Player Statistical Leaders – After Week 4
Points Per Game
Shea Barber (BHL / Team Blendos Black) – 40.5
Britten Zeh (BHL) – 31.0
Cam Hayes (BHL) – 29.3
Aaron Smith (PRP) – 28.5
George Sheley (OFA) – 25.8
Trevor Huntsman (CB) – 24.0
Kevin Kurkowski (PRP) – 22.5
Matt Zynda (RBD) – 22.3
Jonathan Codrington (CB) – 22.0
Graham Wooden (BAM) – 20.5
Total Points
Cam Hayes (BHL) – 117
George Sheley (OFA) – 103
Alex Woeppel (FRO) – 97
Jared Conklin (MAM) – 88
Malachi Ritter (FRO) – 83
Shea Barber (BHL) – 81
David Valmas (FRO) – 80
Jo Annan (BER) – 76
Tony Hendrich (PC) – 76
Kaiden Legree (BAM) – 76
Field Goal Percentage
Graham Wooden (BAM) – 68%
Jonathan Codrington (CB) – 64%
Aaron Smith (PRP) – 64%
Josiah Annan (BER) – 59%
Devon Chabot (PRP) – 58%
Britten Zeh (BHL) – 57%
Ray Williams (OFA) – 57%
Naji Lawrence (MAM) – 57%
Jonah Burness (RBD) – 55%
Finn Dibble (BER) – 55%
2-Point Field Goal Percentage
Cam Hayes (BHL) – 82%
Graham Wooden (BAM) – 76%
Kevin Kurkowski (PRP) – 74%
Finn Dibble (BER) – 69%
Ray Williams (OFA) – 68%
Matt Chic (RBD) – 67%
Sawyer Furman (SDN) – 67%
Dylan Jaklitsch (PRP) – 67%
Aaron Smith (PRP) – 67%
Jonathan Codrington (CB) – 64%
Takeaway on Individuals: Shea Barber and Cam Hayes have been unstoppable offensively for Team Blendos Black, combining for absurd scoring numbers that are carrying the undefeated squad. Graham Wooden remains the efficiency king — his 68% FG and 76% 2PT are video-game numbers that make him a matchup nightmare. The depth of talent is evident: 10 different teams are represented in the top 10 of these categories, showing how spread out the talent is across the 13-team league.
B League Team Statistical Leaders & Analysis – After Week 4
After four weeks and with all 13 B League teams having played at least three games, the 2026 Spring B League has emerged as the most statistically rich, high-scoring, and competitively balanced season in Blendos history.
The league is averaging 75.8 points per game while shooting 43% from the field and 36% from three — numbers that reflect both the influx of talent and the physical, up-tempo style that defines Sunday nights at the Armory.
Defensively, teams are forcing turnovers at a high rate, while rebounding battles are often decided by single digits. A clear tier structure has formed: an undefeated top trio, a battle-tested middle class, and a bottom group still searching for consistency as the seven-game regular season heads toward the top-8 single-elimination playoff cut line.
Below is the complete, category-by-category breakdown with full rankings, league averages, head-to-head comparisons, and expert commentary on what these numbers mean for the rest of the season and the playoffs.
Scoring & Offensive Pace
Points Per Game
Team Blendos (Black) – 92.5
Purple – 88.5
Red – 78.8
Pink – 76.0
Carolina Blue – 70.0
Orchid – 68.2
Green – 65.5
Bello/Richfield (Midnight Navy) – 64.3
Royal Blue – 58.3
MAMCO (Grey) – 57.8
Oneonta Job Corps Academy (White) – 56.8
Sapphire – 52.3
Poolbrook Contracting (Gold) – 50.0
Points Against Per Game
Pink – 53.6 (elite defense)
Red – 55.0
MAMCO (Grey) – 56.0
Carolina Blue – 64.5
Oneonta Job Corps Academy (White) – 64.5
Purple – 66.3
Team Blendos (Black) – 66.5
Orchid – 66.6
Bello/Richfield (Midnight Navy) – 70.8
Sapphire – 72.7
Royal Blue – 84.7
Poolbrook Contracting (Gold) – 96.8
Insight: Team Blendos (Black) leads the league in scoring output, fueled by the explosive duo of Shea Barber and Cam Hayes. Pink, however, is the stingiest defensively, allowing just 53.6 points per game — a mark that could carry them deep into the playoffs if their offense continues to improve. The gap between the top and bottom in points allowed is massive, showing how much defensive identity matters in this league.
Shooting Efficiency
Field Goal Percentage
Purple – 50%
Carolina Blue – 45%
Team Blendos (Black) – 44%
Red – 43%
Bello/Richfield (Midnight Navy) – 42%
Green – 41%
Pink – 39%
Orchid – 38%
MAMCO (Grey) – 38%
Royal Blue – 37%
Oneonta Job Corps Academy (White) – 34%
Poolbrook Contracting (Gold) – 29%
Sapphire – 29%
2-Point Field Goal Percentage
Purple – 59%
Red – 54%
Team Blendos (Black) – 54%
Carolina Blue – 51%
Bello/Richfield (Midnight Navy) – 50%
Green – 47%
Orchid – 46%
Pink – 46%
Royal Blue – 43%
MAMCO (Grey) – 42%
Oneonta Job Corps Academy (White) – 41%
Sapphire – 33%
Poolbrook Contracting (Gold) – 33%
3-Point Field Goal Percentage
Purple – 34%
Team Blendos (Black) – 34%
Bello/Richfield (Midnight Navy) – 34%
Green – 32%
Pink – 28%
Orchid – 28%
Carolina Blue – 28%
MAMCO (Grey) – 27%
Sapphire – 26%
Royal Blue – 22%
Poolbrook Contracting (Gold) – 20%
Free Throw Percentage
Team Blendos (Black) – 76%
MAMCO (Grey) – 65%
Purple – 60%
Bello/Richfield (Midnight Navy) – 57%
Sapphire – 56%
Orchid – 53%
Green – 52%
Oneonta Job Corps Academy (White) – 50%
Pink – 47%
Red – 44%
Carolina Blue – 42%
Royal Blue – 37%
Poolbrook Contracting (Gold) – (not listed in top, lower volume)
Effective Field Goal Percentage
Purple – 56.42%
Team Blendos (Black) – 52.25%
Bello/Richfield (Midnight Navy) – 50.00%
Red – 48.84%
Carolina Blue – 48.51%
Green – 47.61%
Pink – 44.42%
Orchid – 44.01%
MAMCO (Grey) – 41.32%
Royal Blue – 40.00%
Oneonta Job Corps Academy (White) – 39.89%
Sapphire – 36.75%
Poolbrook Contracting (Gold) – 31.83%
True Shooting Percentage
Purple – 57.26%
Team Blendos (Black) – 53.51%
Bello/Richfield (Midnight Navy) – 51.45%
Red – 49.95%
Carolina Blue – 48.49%
Green – 48.45%
Pink – 46.46%
Orchid – 44.91%
MAMCO (Grey) – 44.70%
Royal Blue – 40.88%
Oneonta Job Corps Academy (White) – 40.63%
Sapphire – 37.75%
Poolbrook Contracting (Gold) – 32.20%
Insight: Purple is the efficiency champion, leading the league in FG%, eFG%, and TS%. Team Blendos (Black) is right behind them and combines that efficiency with the highest scoring pace. The bottom four teams (Royal Blue, Oneonta Job Corps Academy (White), Sapphire, Poolbrook Contracting (Gold)) are all shooting under 40% from the field — a clear area they must improve to stay in playoff contention.
Rebounding, Defense & Possession
Rebounds Per Game
Pink – 51.0
MAMCO (Grey) – 46.2
Team Blendos (Black) – 44.3
Carolina Blue – 44.0
Poolbrook Contracting (Gold) – 44.0
Orchid – 40.6
Purple – 40.3
Red – 39.0
Sapphire – 36.3
Oneonta Job Corps Academy (White) – 36.0
Bello/Richfield (Midnight Navy) – 34.5
Royal Blue – 34.3
Green – 30.3
Total Rebounds
Pink – 255
MAMCO (Grey) – 231
Orchid – 203
Team Blendos (Black) – 177
Poolbrook Contracting (Gold) – 176
Purple – 161
Red – 156
Oneonta Job Corps Academy (White) – 144
Bello/Richfield (Midnight Navy) – 138
Carolina Blue – 132
Green – 121
Sapphire – 109
Royal Blue – 103
Blocks
Pink – 22
Red – 22
Orchid – 17
Oneonta Job Corps Academy (White) – 15
MAMCO (Grey) – 13
Green – 11
Carolina Blue – 10
Purple – 10
Royal Blue – 9
Bello/Richfield (Midnight Navy) – 8
Poolbrook Contracting (Gold) – 8
Team Blendos (Black) – 7
Sapphire – 4
Steals
Red – 44
Pink – 42
Orchid – 40
Team Blendos (Black) – 37
Green – 26
MAMCO (Grey) – 26
Oneonta Job Corps Academy (White) – 25
Sapphire – 24
Poolbrook Contracting (Gold) – 23
Royal Blue – 12
Turnovers
Carolina Blue – 44 (lowest)
Sapphire – 45
Team Blendos (Black) – 49
Orchid – 50
Green – 53
Bello/Richfield (Midnight Navy) – 55
Oneonta Job Corps Academy (White) – 56
Royal Blue – 56
Purple – 59
MAMCO (Grey) – 66
Red – 74
Pink – 80
Poolbrook Contracting (Gold) – 95
Opponent Field Goal Percentage
MAMCO (Grey) – 33%
Red – 33%
Carolina Blue – 34%
Pink – 34%
Team Blendos (Black) – 35%
Orchid – 38%
Purple – 39%
Royal Blue – 42%
Sapphire – 43%
Oneonta Job Corps Academy (White) – 44%
Green – 44%
Poolbrook Contracting (Gold) – 47%
Bello/Richfield (Midnight Navy) – 48%
Opponent 3-Point Field Goal Percentage
Team Blendos (Black) – 20%
MAMCO (Grey) – 22%
Red – 23%
Oneonta Job Corps Academy (White) – 25%
Sapphire – 25%
Pink – 25%
Carolina Blue – 29%
Orchid – 31%
Royal Blue – 31%
Purple – 32%
Poolbrook Contracting (Gold) – 33%
Bello/Richfield (Midnight Navy) – 35%
Green – 38%
Insight: Pink leads the league in rebounding and is tied for the best blocks total, making them a physical nightmare on the glass. Red dominates steals and holds opponents to just 33% shooting. Team Blendos (Black) is the best at limiting opponent threes (20%). The bottom teams (Poolbrook Contracting (Gold), Royal Blue, Sapphire) are allowing the highest opponent shooting percentages — a clear area they must address to climb into the top 8.
Playmaking & Advanced Metrics
Assists
Team Blendos (Black) – 100
Purple – 94
Pink – 88
Red – 81
Orchid – 74
MAMCO (Grey) – 66
Green – 50
Bello/Richfield (Midnight Navy) – 46
Carolina Blue – 44
Poolbrook Contracting (Gold) – 42
Oneonta Job Corps Academy (White) – 39
Royal Blue – 35
Sapphire – 33
Effective Field Goal Percentage
Purple – 56.42%
Team Blendos (Black) – 52.25%
Bello/Richfield (Midnight Navy) – 50.00%
Red – 48.84%
Carolina Blue – 48.51%
Green – 47.61%
Pink – 44.42%
Orchid – 44.01%
MAMCO (Grey) – 41.32%
Royal Blue – 40.00%
Oneonta Job Corps Academy (White) – 39.89%
Sapphire – 36.75%
Poolbrook Contracting (Gold) – 31.83%
True Shooting Percentage
Purple – 57.26%
Team Blendos (Black) – 53.51%
Bello/Richfield (Midnight Navy) – 51.45%
Red – 49.95%
Carolina Blue – 48.49%
Green – 48.45%
Pink – 46.46%
Orchid – 44.91%
MAMCO (Grey) – 44.70%
Royal Blue – 40.88%
Oneonta Job Corps Academy (White) – 40.63%
Sapphire – 37.75%
Poolbrook Contracting (Gold) – 32.20%
Insight: Team Blendos (Black) leads the league in assists, showing elite ball movement that complements their high scoring. Purple leads in both eFG% and TS%, proving they are the most efficient team overall. The bottom teams are struggling mightily with both volume and efficiency — a combination that makes their path to the top 8 extremely difficult.
Expert Overall Assessment & Playoff Implications
Tier 1 – Championship Favorites
Team Blendos (Black), Purple, Red: All three are undefeated or near the top with dominant scoring, efficiency, and rebounding. Team Blendos (Black) has the highest offensive ceiling; Purple has the best efficiency; Red dominates steals and rebounding.
Tier 2 – Strong Playoff Contenders
Pink, MAMCO (Grey), Orchid, Carolina Blue: Pink leads in rebounding and blocks. MAMCO and Orchid bring veteran balance. Carolina Blue is efficient and low-turnover.
Tier 3 – In the Mix
Green, Bello/Richfield (Midnight Navy): They have flashes of talent but need more consistency.
Tier 4 – Fighting for Seeding
Oneonta Job Corps Academy (White), Royal Blue, Sapphire, Poolbrook Contracting (Gold): These teams are 0-3 or 1-3. They have talent but must drastically reduce turnovers and improve shooting to reach the top 8.
League-Wide Storylines
The undefeated top three have separated themselves, but the middle pack is deep enough that any slip-up could cost a top seed.
Defensive identity is winning games: Pink, Red, and MAMCO are the best at forcing misses and turnovers.
The bottom four teams are allowing opponent FG% in the mid-40s or higher — a recipe for missing the playoffs unless they make major adjustments.
The 2026 B League is the most talented and statistically impressive season yet. With only three games left for most teams and a single-elimination playoff for the top 8, the margin for error is razor-thin. Every possession, every rebound, and every defensive stop will decide who makes the playoffs and who goes home early.
This league is delivering exactly what Blendos was built for — high-level, competitive, family-friendly basketball with real stakes every Sunday. The top-8 race is wide open, and the playoffs are going to be electric.
2026 Summer League Begins on 6/07


Comments